№2(3), 2018
Democracy in Retreat: crisis of core democratic values, traditional election system, and effects of mass migration in the EU
Statistical Analysis of Democracy vs. Non-democracy Government Type Based on CIA The World Factbook 2017
Ivan Gorshkov,
second year master’s student,School of Governance and Politics, MGIMO University
Abstract: In this paper study the effect of selected features on the usage of the word «Democracy» in the Government type description in the CIA The World Factbook 2017. The hypothesis is tested using OLS regression is used with p < 0.05, 0.10, 0.15 significance rule. The number of population below poverty line, the potential support ratio, and the internet users percent of population have proven to have an effect on the dependant variable.
Key words: factbook, dataset, democracy, rate, regression
Methodology
The CIA The World Factbook 2017[1] dataset was parsed into the 261 by 937 matrix. From this matrix 11 features were selected on the basis of relatively lower sparsity and scientific intuition:
- GDP (purchasing power parity): gross domestic product based on purchasing power parity [2]
- Net migration rate: the difference between the number of immigrants and the number of emigrants
- Population below poverty line
- Potential support ratio: the number of people age 15–64 per one older person aged 65 or older
- Population growth rate
- Rate of urbanization: describes the projected average rate of change of the size of the urban population over the period
- Budget surplus (+) or deficit (-)
- Real growth rate - the rate at which a nation's Gross Domestic product changes/grows from one year to another
- Government consumption: government spending which buys goods and services produced in the economy and which is not a transfer payment of money collected in taxation from one group in society to another
- Public debt
- Internet users percent of population
Based on the above features the new data table was formed, from which certain entries were eliminated. First, entries that did not include information about the government type were removed. Second, entries that are more than 60% sparse (containing more than or equal to 5 missing values) were removed. The remaining matrix which is the object of an experiment is 213 by 11.
For the sake of an experiment design, the min-max normalization was applied for the formed matrix. Then missing values were replaced with -1 to attribute the fact that the missing data is of type MNAR[3].
The dependant variable vector represents the appearance of the word “Democracy” in the Government type description in the original dataset. The dependant variable vercor is thus a vector with two categories (yes - Government type description includes the string “Democracy”, and no - it doesn’t include).
A simple ordinary least squares model is used to test correlation hypotheses between 11 independent variables (features) and target categorical dependant variable. To determine statistical significance the rejection rule is set to be p < 0.05, p<0.15, p<0.20 which is relatively soft but adequate due to the nature of dataset.
Results

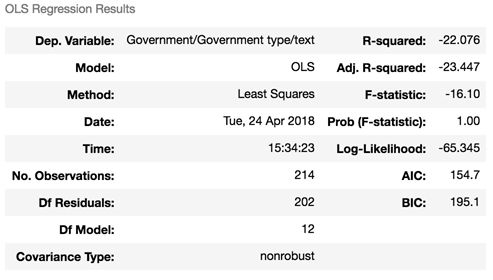
The R-square of -22.076 indicates that around 22% of variation in the word “democracy” appearance in the description of the government type is explained by the selected features.

Among the 11 studied variables, only 3 were determined to be statistically significant according to the rule p < 0.05 for the studied target: the number of population below poverty line, the potential support ratio, and the internet users percent of population. The Population growth rate are significant only on the p < 0.15 significance level. The real growth rate has a significant effect on the dependent variable is significant only on the p < 0.20 significance level. The effect of other variables is determined to be statistically insignificant.

Sources
- Central Intelligence Agency. "CIA The World Factbook 2017." cia.gov. Central Intelligence Agency, n.d. Web. 17 Mar. 2011.
- Paul Schreyer and Francette Koechlin (March 2002). "Purchasing power parities – measurement and uses" (PDF). Statistics Brief. OECD (3)
- Little, Roderick (2002). Statistical analysis with missing data. Hoboken, N.J: Wiley. ISBN 978-0471183860
